Lake Norman waterfront home sales for March 2018.
Huge slow-down noted this March vs. March of 2017.
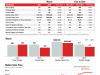
I’ve heard it from many agents-this past March seemed slow in the Lake Norman waterfront market. Compared to last March, the number of closed sales was down 50% in the following price ranges sampled: $500,000 to $749,999, $750,000-$999,999 and $2.0 million to $2.99 million. The $1.0 to $1.99 million category saw a drop of nearly 42%.
Inventory continues to drop. While March of 2017 was a solid buyer’s market, we’re now seeing waterfront inventory drop 43% to 64%- putting us closer to and inside of a seller’s market. But it’s nowhere close to the intense seller’s market that exists in non-waterfront/lower-priced home categories.
New listings in March of 2018 were down, way down. The $1.0 million to $1.99 million group saw an 88% drop- from 42 in March of 2017 to just 4 in 2018. On the plus side, this price group saw a nice 42% jump in the median sales price.
The median sales price for the other groups showed mixed results. Comparing March of 2018 vs. March of 2017, we saw the median sales price drop about 2% for waterfront properties that sold in the $500,000 to $749, 999 range and drop 3% in the $750,000 to $999,999 price range. Median sales price was up about 9% in the $2-$3 million category- but there was only 1 sale in March.
Be sure to scroll through the 7 custom charts I created. Data provided by the Charlotte Regional Realtor Association.
We are now entering the traditionally active part of the home selling season. The Lake Norman waterfront market is a different animal, but I suspect we’ll see this market see an uptick in sales and new listings in April, May and June. I sure hope so. I have many clients on the prowl. And, if you are thinking of selling your waterfront home then the time is now!
 Number of new listings March 2018


")
")